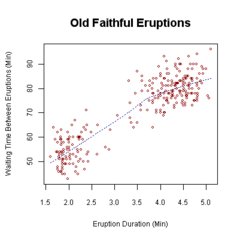
Scatter plots are a visualization tool that typically puts a set of data and shows its number of occurrences throughout time, each dot represents one event that has occurred. This graph maps out the duration and time in between eruptions of Old Faithful in Yellowstone National Park.

No comments:
Post a Comment