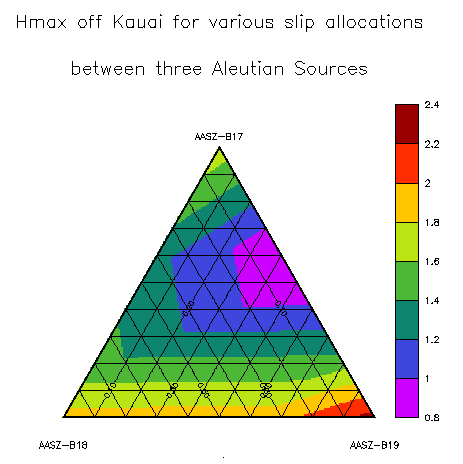
A triangular plot graphically represents three variables that end equaling some sort of constant. This is a fairly complex question that can be clarified by this type of geovisualization. This particular plot shows the impact of waves generated from three different sites crashing on the coast of a Hawaiin island.

No comments:
Post a Comment